I noticed that my hard drives in my Ubuntu server was not spinning down after being idle and thus I needed a way to monitor their power states and to verify through trial and error if any of my attempts is working or not. Enter Prometheus to the rescue!
I will be following this guide to start with.
This article will cover the following:
- Install Prometheus on Ubuntu 20.04.
- Configure Prometheus to be run as a systemd service.
- Securing Prometheus with basic authentication and TLS.
- Install Prometheus Node Exporter and run it as a systemd service.
- Enable the textfile collector and write our first script to output metrics.
- Use the community provided smartmon script. [I ended up not trusting this in the end].
- Roll my own script that uses openSeaChest to output metrics.
Prerequisites
- Update system.
$ sudo apt update && sudo apt upgrade
# Optionally remove packages no longer used
$ sudo apt autoremove
- Create required directories.
$ sudo mkdir -p /etc/prometheus
$ sudo mkdir -p /var/lib/prometheus
- Check what is the latest Linux release from: https://prometheus.io/download/ and copy the link.
Download and Install
- Download and extract.
$ wget https://github.com/prometheus/prometheus/releases/download/v2.34.0/prometheus-2.34.0.linux-amd64.tar.gz
$ tar -xvf prometheus-2.34.0.linux-amd64.tar.gz
- Copy the binaries and other files into place.
$ cd prometheus-2.34.0.linux-amd64
$ sudo cp prometheus promtool /usr/local/bin/
$ sudo cp -r consoles/ console_libraries/ /etc/prometheus/
$ sudo cp prometheus.yml /etc/prometheus/prometheus.yml
- Verify.
$ cd ~
$ prometheus --version

prometheus, version 2.34.0 (branch: HEAD, revision: 881111fec4332c33094a6fb2680c71fffc427275)
  build user:       root@121ad7ea5487
  build date:       20220315-15:18:00
  go version:       go1.17.8
  platform:         linux/amd64

$ promtool --version

promtool, version 2.34.0 (branch: HEAD, revision: 881111fec4332c33094a6fb2680c71fffc427275)
  build user:       root@121ad7ea5487
  build date:       20220315-15:18:00
  go version:       go1.17.8
  platform:         linux/amd64
Configure permissions
- Create a group and user specifically to be used by Prometheus
$ sudo groupadd --system prometheus
$ sudo useradd -s /sbin/nologin --system -g prometheus prometheus
- Set permissions.
$ sudo chown -R prometheus:prometheus /etc/prometheus/ /var/lib/prometheus/
$ sudo chmod -R 775 /etc/prometheus/ /var/lib/prometheus/
Configure Prometheus to be run as a systemd service
- Create the .service file
$ sudo vi /etc/systemd/system/prometheus.service

# Add the following
[Unit]
Description=Prometheus
Wants=network-online.target
After=network-online.target

[Service]
User=prometheus
Group=prometheus
Restart=always
Type=simple
ExecStart=/usr/local/bin/prometheus \
    --config.file=/etc/prometheus/prometheus.yml \
    --storage.tsdb.path=/var/lib/prometheus/ \
    --web.console.templates=/etc/prometheus/consoles \
    --web.console.libraries=/etc/prometheus/console_libraries \
    --web.listen-address=0.0.0.0:9090

[Install]
WantedBy=multi-user.target
I would recommend you first check which ports are already in use and assign maybe a less obvious port number. To see what ports are being used to listen on, run netstat -tulpn | grep LISTEN
- Edit the file
/etc/prometheus/prometheus.ymlto suit your purposes. - Enable the service to start at boot.
$ sudo systemctl enable prometheus
- Start Prometheus and verify.
$ sudo systemctl start prometheus
$ sudo systemctl status prometheus
...
● prometheus.service - Prometheus
     Loaded: loaded (/etc/systemd/system/prometheus.service; enabled; vendor preset: enabled)
     Active: active (running) since Tue 2022-03-22 16:34:37 UTC; 15s ago
   Main PID: 57191 (prometheus)
      Tasks: 10 (limit: 76945)
     Memory: 19.4M
Allow access from firewall
I use UFW so will allow access to the service only from the specific NIC and ip-port.
# Get the name of the NIC to use
$ ip a
...
2: enp2s0: <BROADCAST,MULTICAST,UP,LOWER_UP> ...

# port 9090 here is what prometheus was configured on
$ sudo ufw allow in on enp2s0 proto tcp to 192.168.x.x port 9090
- Open the dashboard in your browser (e.g. http://192.168.x.x:9090)
Securing Prometheus
Next I will be setting up Basic Auth following the official guide.
- Generate a password hash using bcrypt. For this we need to install python3-bcrypt.
$ sudo apt install python3-bcrypt
- Create a script called
gen-bcrypt-password.py.
import getpass
import bcrypt

password = getpass.getpass("password: ")
hashed_password = bcrypt.hashpw(password.encode("utf-8"), bcrypt.gensalt())
print(hashed_password.decode())
- Run the script and enter a password to be hashed.
$ python3 gen-bcrypt-password.py

password:
$2b$12$z2shPn1IGtuyj7CL3E1Tb.dnci.HA7KXxFFysng3rWViTpaZK0LMS
- Create the
/etc/prometheus/web.ymlconfig file. The username in the example is admin.
$ sudo vi /etc/prometheus/web.yml
basic_auth_users:
    admin: $2b$12$z2shPn1IGtuyj7CL3E1Tb.dnci.HA7KXxFFysng3rWViTpaZK0LMS
- Verify the config file.
# Change the permissions
$ sudo chown prometheus:prometheus /etc/prometheus/web.yml
$ sudo chmod 640 /etc/prometheus/web.yml

$ sudo promtool check web-config /etc/prometheus/web.yml
/etc/prometheus/web.yml SUCCESS
- Change the systemd service to start Prometheus using this new web.yml config file.
$ sudo vi /etc/systemd/system/prometheus.service

# Modify this setting to include
ExecStart=
...
# Add this bit (ensure you add \ to the previous line)
    --web.config.file=/etc/prometheus/web.yml

# Restart the service
$ sudo systemctl daemon-reload
$ sudo systemctl restart prometheus
$ sudo systemctl status prometheus
- Verify.
$ curl --head http://localhost:9090/graph
HTTP/1.1 401 Unauthorized

# Open the dashboard in your browser again and you should be
# asked for username and password.
Enable TLS
I will be using a self signed certificate for my server since it is only accessible from the local network.
I found this article showing how you can generate a self signed certificate using an IP address.
- Create a script called
generate-ip-cert.sh.
#!/bin/sh
# Generate a self signed certificate using the IP
# Based on: https://raw.githubusercontent.com/antelle/generate-ip-cert/master/generate-ip-cert.sh

IP=$(echo $1 | egrep -o "^[0-9]{1,3}\.[0-9]{1,3}\.[0-9]{1,3}\.[0-9]{1,3}$")

if [ ! $IP ]
then
    echo "Usage: generate-ip-cert.sh 127.0.0.1"
    exit 1
fi

echo "[req]
default_bits = 4096
distinguished_name = req_distinguished_name
req_extensions = req_ext
x509_extensions = v3_req
prompt = no

[req_distinguished_name]
countryName = XX
stateOrProvinceName = N/A
localityName = N/A
organizationName = Self-signed certificate
commonName = $IP: Self-signed certificate

[req_ext]
subjectAltName = @alt_names

[v3_req]
subjectAltName = @alt_names

[alt_names]
IP.1 = $IP
" > san.cnf

openssl req -x509 -nodes -days 3650 -newkey rsa:4096 -keyout key.pem -out cert.pem -config san.cnf
rm san.cnf
- Run the script and move the files to /etc/prometheus.
$ ./generate-ip-cert.sh 192.168.x.x

$ sudo mv cert.pem key.pem /etc/prometheus
$ sudo chown prometheus:prometheus /etc/prometheus/*.pem
- Edit the /etc/prometheus/web.yml file and add the following at the beginning.
tls_server_config:
  cert_file: /etc/prometheus/cert.pem
  key_file: /etc/prometheus/key.pem
- Restart prometheus and verify.
$ sudo systemctl daemon-reload
$ sudo systemctl restart prometheus
You will have issues getting your browser to trust the self signed certificate. What I have done is to copy the cert.pem file over to my Mac and import it into Keychain. Then “Get Info” on the certificate and change the trust settings to “Always Trust”.
Now I can open https://192.168.x.x:9090 in my browser and I am asked for the username and password and the site shows that it is protected by TLS.
Gather the first metrics
To gather some system metrics I will be installing and using the Prometheus Node Exporter following the official guide.
- Copy the link to the latest release from here.
- Download and extract.
$ wget https://github.com/prometheus/node_exporter/releases/download/v1.3.1/node_exporter-1.3.1.linux-amd64.tar.gz
$ tar xvfz node_exporter-*.*-amd64.tar.gz
- Do a test run.
$ cd node_exporter-*.*-amd64
$ ./node_exporter
...
# See some output.

# Start a new SSH session and get the metrics from this new service
$ curl http://localhost:9100/metrics
...
# See some metric output.
- Install node_exporter similar to how I installed prometheus.
$ sudo cp node_exporter /usr/local/bin/
$ sudo vi /etc/systemd/system/node_exporter.service
[Unit]
Description=Node Exporter
After=network.target

[Service]
User=prometheus
Group=prometheus
Type=simple
ExecStart=/usr/local/bin/node_exporter

[Install]
WantedBy=multi-user.target
- Start the service.
$ sudo systemctl daemon-reload
$ sudo systemctl start node_exporter
# Enable the service to start at boot
$ sudo systemctl enable node_exporter

# Check status
$ sudo systemctl status node_exporter
- Configure Prometheus to gather the metrics from node_exporter.
$ sudo vi /etc/prometheus/prometheus.yml

# Add the following into the scape_configs section
  - job_name: 'node_exporter_metrics'
    scrape_interval: 1m
    static_configs:
      - targets: ['localhost:9100']

$ sudo systemctl daemon-reload
$ sudo systemctl restart prometheus
- Open the Prometheus dashboard and try a query. For example: node_hwmon_temp_celsius gives me the temperature sensors.
- I don’t need to gather all the default enabled metrics so instead I will disable all the collectors and only turn on the ones I am interested in. To do so you modify the systemd
node_exporter.servicefile.
# Example of disabling all collectors and then specify each collector individually
ExecStart=/usr/local/bin/node_exporter \
    --collector.disable-defaults \
    --collector.<name>
“Real world” usage: Check how often my drives are being spin up
While trying to figure out why my drives are no longer being put to sleep while idle, I came across this article from Peter Marheine which is what lead me to install and use Prometheus in the first place.
In order to gather metrics from smartmon I will need to use the textfile collector from node_exporter.
- Create the location for where the textfile collector will read .prom files from.
$ sudo mkdir -p /var/lib/prometheus/textfiles
$ sudo chown prometheus:prometheus /var/lib/prometheus/textfiles
- Enable the textfile collector and configure the directory to use.
$ sudo vi /etc/systemd/system/node_exporter.service

# Modify this value to include the textfile collector if needed
# and you do need to set the textfile.directory
ExecStart=/usr/local/bin/node_exporter \
    --collector.textfile \
    --collector.textfile.directory=/var/lib/prometheus/textfiles

# Reload service
$ sudo systemctl daemon-reload
$ sudo systemctl restart node_exporter
$ sudo systemctl status node_exporter
- Create the directory in which we will store the scripts/binaries that produce textfiles.
$ sudo mkdir -p /usr/local/bin/node_exporter_textfile_collector
Trial run
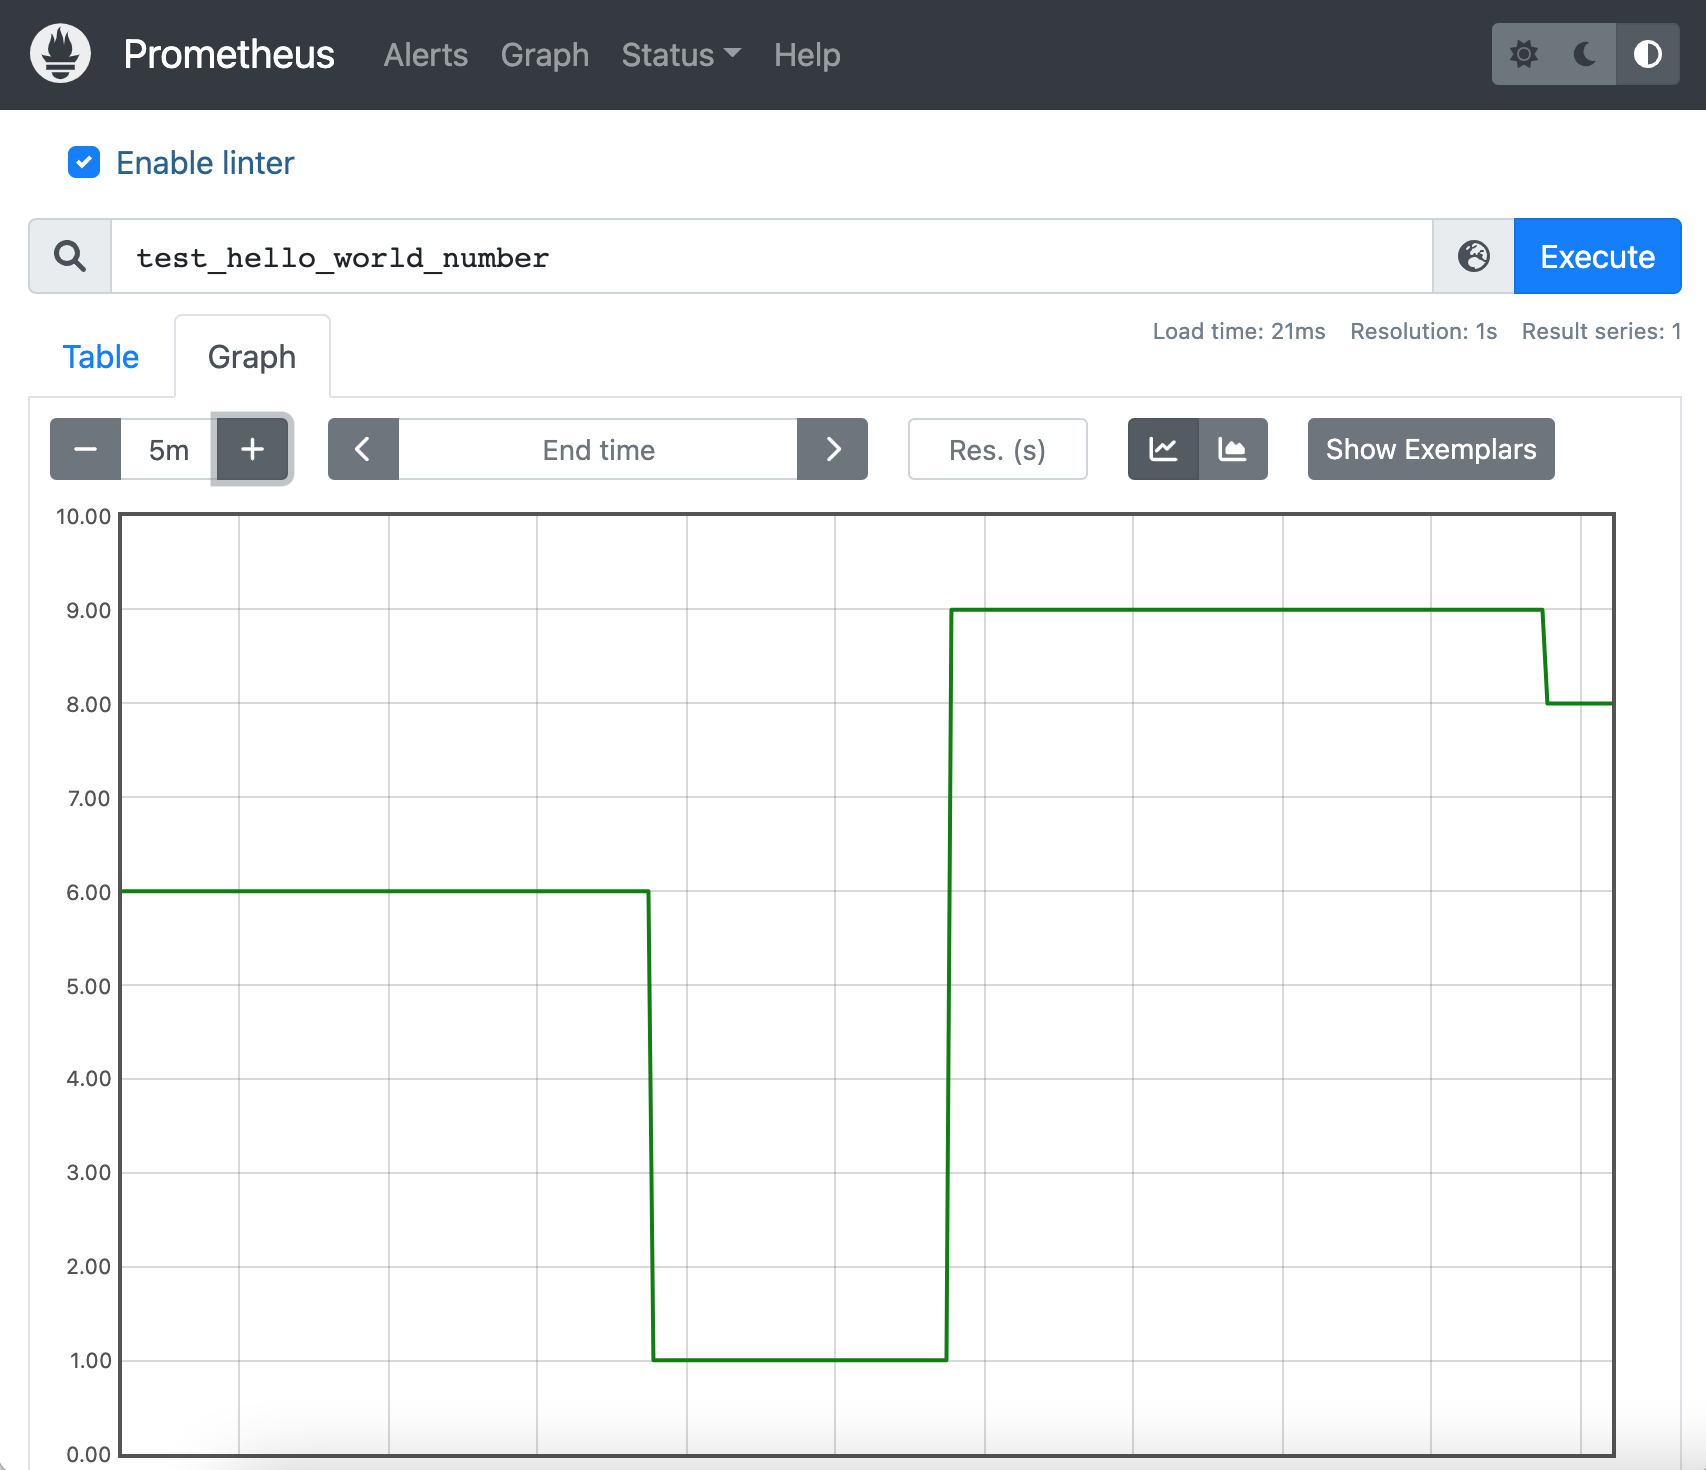
- Lets create a test script and see that the metrics are picked up. The script will generate a random number between 0 and 10 and store it under the name “test_hello_world_number”.
$ sudo vi /usr/local/bin/node_exporter_textfile_collector/hello_world.sh

#!/bin/bash
MAGIC=`shuf -i 0-10 -n 1`
echo '# HELP test_hello_world_number Used for testing that the textfile collector is working'
echo '# TYPE test_hello_world_number gauge'
echo "test_hello_world_number ${MAGIC}"

# Save and change permissions
$ sudo chmod +x /usr/local/bin/node_exporter_textfile_collector/hello_world.sh
# Run the script a couple of times and you should see output like this

# HELP test_hello_world_number Used for testing that the textfile collector is working
# TYPE test_hello_world_number gauge
test_hello_world_number 4
- Since we will be using the smartmon script provided by the community they recommend you use
spongeto write the output files. Looking into this it is because you want to ensure a textfile’s metrics is written completely before node_exporter starts reading metrics. I.e. atomically. To install spongesudo apt install moreutils. - Run the test script a couple of times and check the dashboard for the metrics. My Prometheus is configured to scrape from node_exporter once every minute, so I will have to wait at least a minute before results start showing up.
$ sudo sh -c '/usr/local/bin/node_exporter_textfile_collector/hello_world.sh | sponge \
/var/lib/prometheus/textfiles/test_hello_world.prom'
Smartmon monitoring
- Download the community smartmon.sh and store it as
/usr/local/bin/node_exporter_textfile_collector/smartmon.sh. Make it executablesudo chmod +x - Run the script as root to ensure smartmon metrics are reported.
$ sudo /usr/local/bin/node_exporter_textfile_collector/smartmon.sh
...
# Expect to see a lot of stats here. If you only get the version then the
# user running the script does not have enough permissions for smartctlCreate a systemd timer to run the script every 5 minutes and to produce a textfile for node_exporter to pick up.
- I will be using cron to schedule the script to be run every 5 minutes.
$ sudo crontab -e

# Export smartctl metrics to Prometheus
*/5 * * * * /usr/local/bin/node_exporter_textfile_collector/smartmon.sh | sponge /var/lib/prometheus/textfiles/smartmon.prom
- Although this script captures a treasure trove of information it is however ironically keeping my disks active. Maybe a bug with Seagate drives and this script?
Time to roll my own script
See my other article about openSeaChest for more details on using Seagate’s openSeaChest tools.
Since I am using openSeaChest to correctly control my Seagate drives I will use openSeaChest_PowerControl to report on the power status and capture that to a textfile for node_exporter to pick up.
- First ensure that the binary can be accessed correctly.
$ sudo cd openSeaChest/builddir
$ sudo mkdir -p /usr/local/bin/openSeaChest
$ sudo cp openSeaChest_* /usr/local/bin/openSeaChest/
- By running openSeaChest_PowerControl, I discovered all the states I am interested in.
$ sudo /usr/local/bin/openSeaChest/openSeaChest_PowerControl \
-q -d /dev/... --checkPowerMode

# This is the list of the various states

Device is in the PM0: Active state or PM1: Idle State
Device is in the PM2: Standby state and device is in the Standby_z power condition
Device is in the PM2: Standby state.
Device is in the PM1: Idle state and the device is in the Idle_a power condition
Device is in the PM1: Idle state and the device is in the Idle_b power condition
Device is in the PM1: Idle state and the device is in the Idle_c power condition
- Create the script
/usr/local/bin/node_exporter_textfile_collector/drive_powermode.sh
#!/bin/bash
# Check drive states and report it as metrics for the node exporter textfile collector

echo '# HELP andre_drive_powermode Report the power mode of the /dev/sd? drives'
echo '# TYPE andre_drive_powermode gauge'

function checkPowerMode() {
    local guage=1.0
    local powerMode=$(/usr/local/bin/openSeaChest/openSeaChest_PowerControl -q -d $1 --checkPowerMode)

    if echo $powerMode | grep -q -w 'Active'; then
        guage=1.0
    elif echo $powerMode | grep -q -w 'Standby'; then
        guage=0.0
    elif echo $powerMode | grep -q -w 'Idle_c'; then
        guage=0.25
    elif echo $powerMode | grep -q -w 'Idle_b'; then
        guage=0.5
    elif echo $powerMode | grep -q -w 'Idle_a'; then
        guage=0.75
    fi

    echo "andre_drive_powermode{dev=\"$1\"} $guage"
}

for drive in /dev/sd? ; do
    checkPowerMode $drive
done
- Schedule the script to be run every 5 minutes and to produce the .prom file.
$ sudo crontab -e

# Export drive power mode metrics to Prometheus
*/5 * * * * /usr/local/bin/node_exporter_textfile_collector/drive_powermode.sh | sponge /var/lib/prometheus/textfiles/drive_powermode.prom
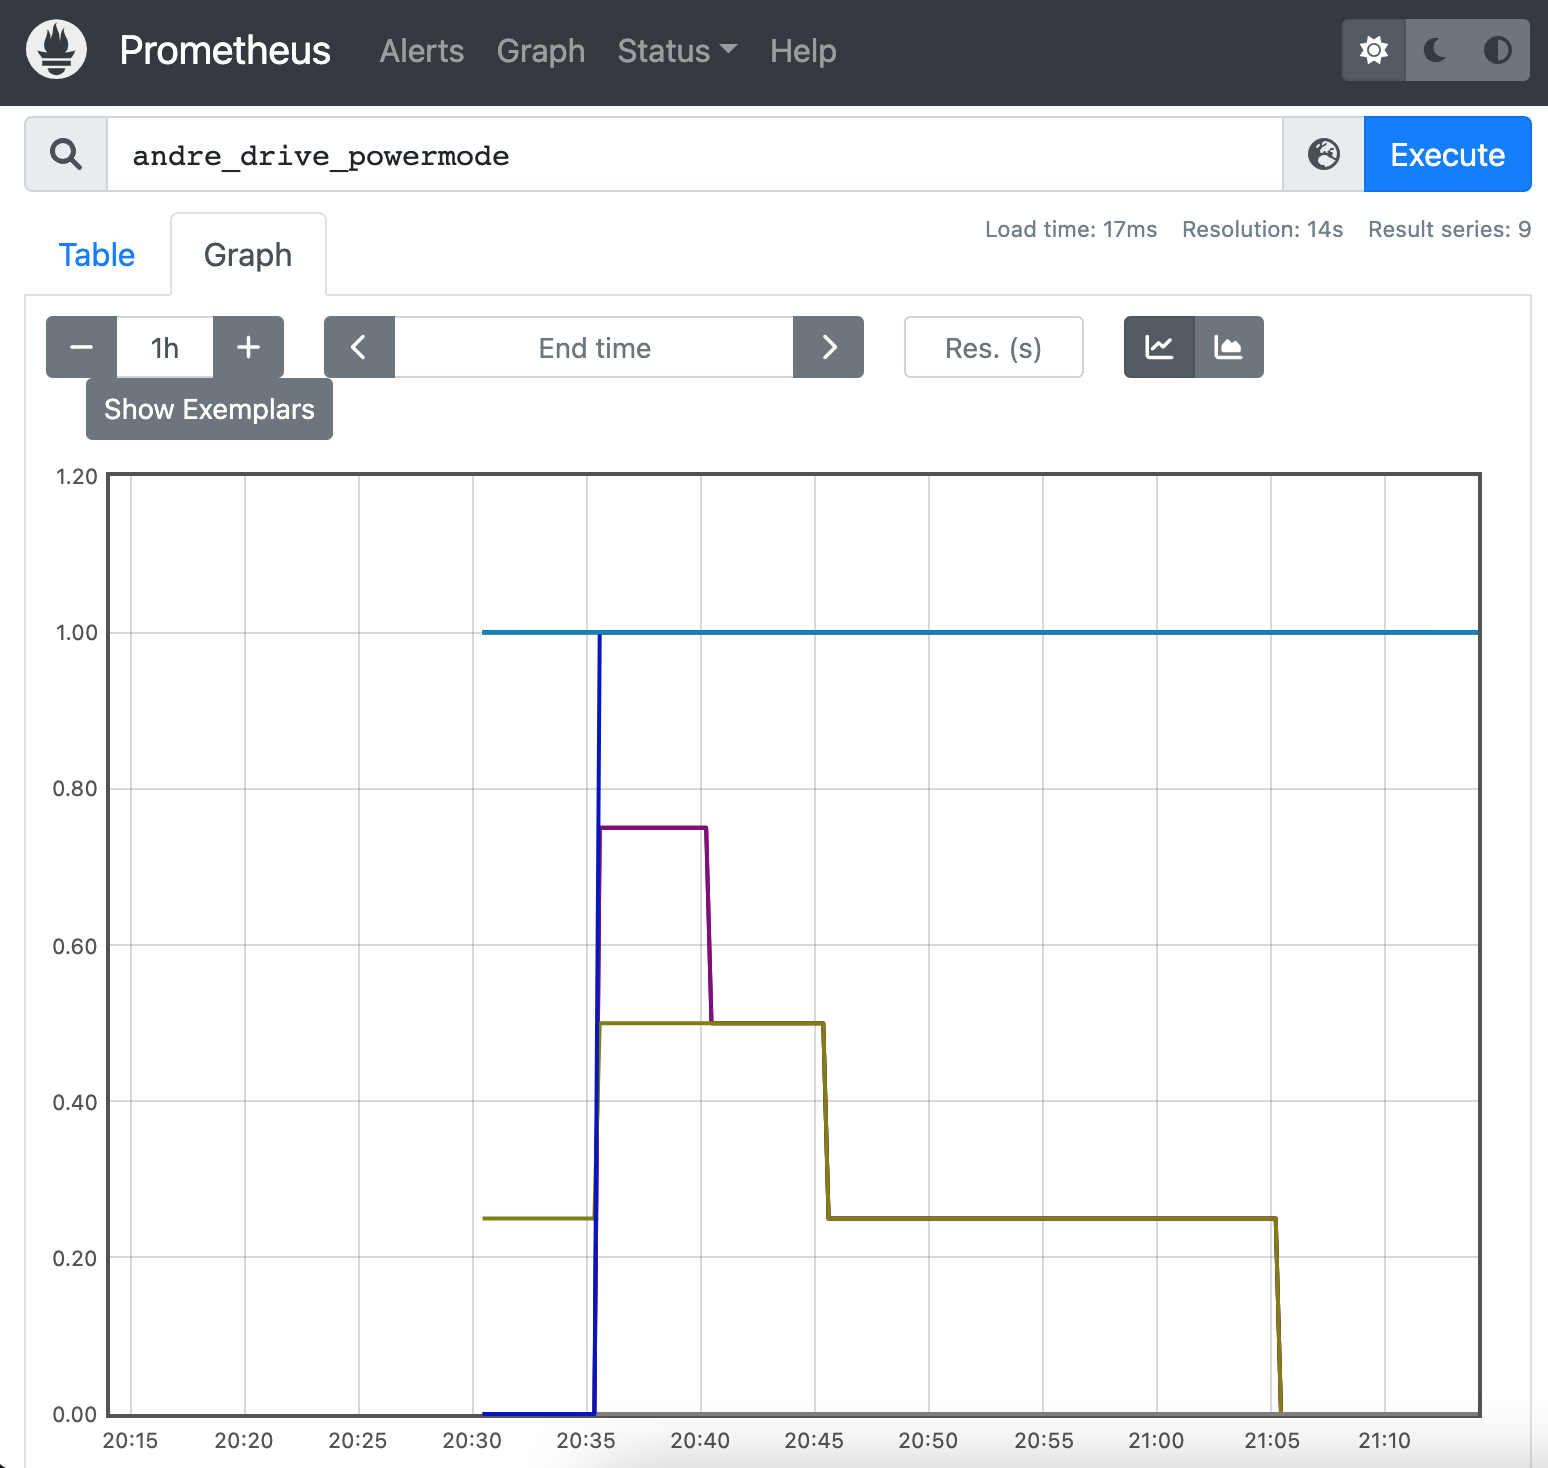
On the Prometheus dashboard I can already see that drives have started going into the various idle states.
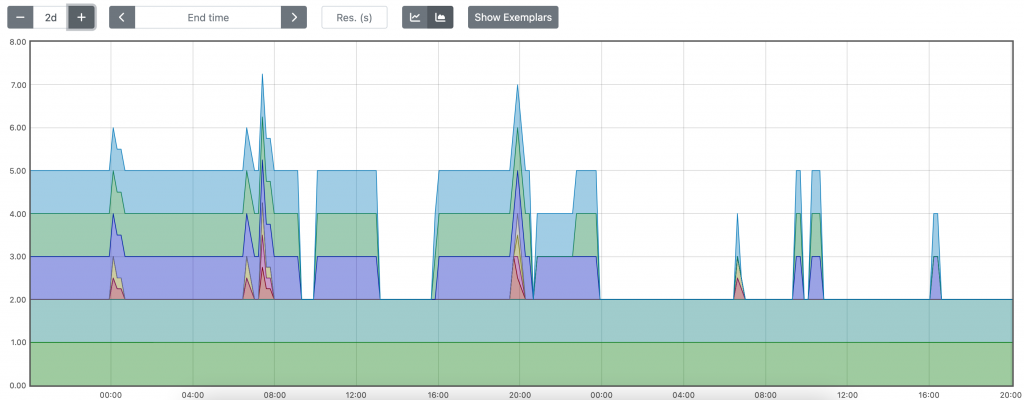
After two days of trial and error I have finally managed to get the drives to spin down after about 25 minutes of inactivity.

1 comment on “Installing Prometheus on Ubuntu 20.04”
Comments are closed.