
Featured image by Egon Elbre
Custom Errors
- You can export custom errors in your package and use the
errorspackage to create them.
import "errors"

var (
	ErrNotANumber = errors.New("Classic NaN issue")
	ErrFailedToOpen = errors.New("Door is shut")
)
// Convention is to prefix with Err (or err if private)
- Convention is to use
errfor the variable name receiving a potentially returned error. - You can use
fmt.Fprintlnto output an error toSTDERR.
fmt.Fprintln(os.Stderr, err)
- Use
fmt.Errorfto create new formatted errors which may also contain an existing error to be “unwrapped” with the%wspecifier..
func something() error {
	return fmt.Errorf("Encountered error %w because of %d", ErrFailedToOpen, 42)
}

err := something()
if err != nil {
	fmt.Fprintln(os.Stderr, err)
}
CSV file support
- Go has a standard library package for working with CSV files.
- Reading from a CSV file.
import "encoding/csv"

f, err := os.Open(fname)
// handle err and defer closing of file

csvReader := csv.NewReader(f) // takes an io.Reader
// Read all records into memory as [][]string
data, err := csvReader.ReadAll()
// there is also Read to read a single row at a time
- Writing to an io.Writer.
writer := csv.NewWriter(os.Stdout)
writer.WriteAll(data) // data = [][]string

// or
writer.Write(row) // row = []string
Benchmarking
- On Unix style shells you can use the
timecommand to time how long an operation took. NOTE: However the format of the Zsh built-in is different to the output of Bash. This can be changed by specifying the TIMEFMT environment variable. See this SO post.
$ TIMEFMT=$'real\t%E\nuser\t%U\nsys\t%S'
$ time sleep 2
real    2.01s
user    0.00s
sys     0.00s
- In Go you can provide benchmarking functions as part of the unit-tests.
func someBenchmark(b *testing.B) {
// prepare some inputs etc.

	b.ResetTimer() // This ensure the setup time above is not part of the timings

	for i := 0; i < b.N; i++ {
		// code to be benchmarked
	}
}
- To run benchmarks you use
go testand with the-bench regexpargument. It is good to ensure no unit-tests are run by using-run ^$(so that no unit-test match the regexp).
$ go test -bench . -run ^$
- b.N is adjusted so that the benchmark runs for roughly about 1 second. You can use
-benchtime=argument to adjust this.
$ go test -bench . -benchtime=20x -run ^$ | tee results.txt
Profiling
- Go comes with built-in profiling and tracing tools.
- To perform a CPU profile while running a bench mark.
$ go test -bench . -benchtime=10x -run ^$ -cpuprofile cpu00.pprof

$ go tool pprof cpu00.pprof
Type: cpu
Time: May 3, 2022 at 7:56pm (BST)
Duration: 3.63s, Total samples = 3.67s (101.09%)
Entering interactive mode (type "help" for commands, "o" for options)
(pprof)

# enter 'top' to see where most of the time is spend
(pprof) top
Showing nodes accounting for 3.59s, 97.82% of 3.67s total
Dropped 29 nodes (cum <= 0.02s)
Showing top 10 nodes out of 82
      flat  flat%   sum%        cum   cum%
     2.99s 81.47% 81.47%      2.99s 81.47%  syscall.syscall
     0.21s  5.72% 87.19%      0.21s  5.72%  runtime.madvise
     0.12s  3.27% 90.46%      0.12s  3.27%  runtime.pthread_cond_wait
...

# Use 'top -cum' to see cummalitive time being spent
(pprof) top -cum

# Use 'list someFunction' to see source code listing and time spent on which lines.
(pprof) list myPackage.thisTakesTooLong
- To perform a memory profile.
$ go test -bench . -benchtime=10x -run ^$ -memprofile mem00.pprof

$ go tool pprof -alloc_space mem00.pprof
(pprof) top -cum
...
2.02GB 40.36% 75.11%     3.21GB 64.18%  encoding/csv.(*Reader).ReadAll
- To run a benchmark and also get a summary of allocations being made.
$ go test -bench . -benchtime=10x -run ^$ -benchmem | tee benchresults00m.txt
...
someBenchmark-8                10         311644288 ns/op        495584000 B/op   5041044 allocs/op
- pprof can generate a nice call / usage graph when you enter
webat the pprof prompt. However you will need to have graphviz installed. (brew install graphviz). - To compare two benchmarks you can use the “benchstat” tool.
# To install it
$ go install golang.org/x/perf/cmd/benchstat@latest

# To compare two benchmarks
$ ~/go/bin/benchstat results00.txt results01.txt
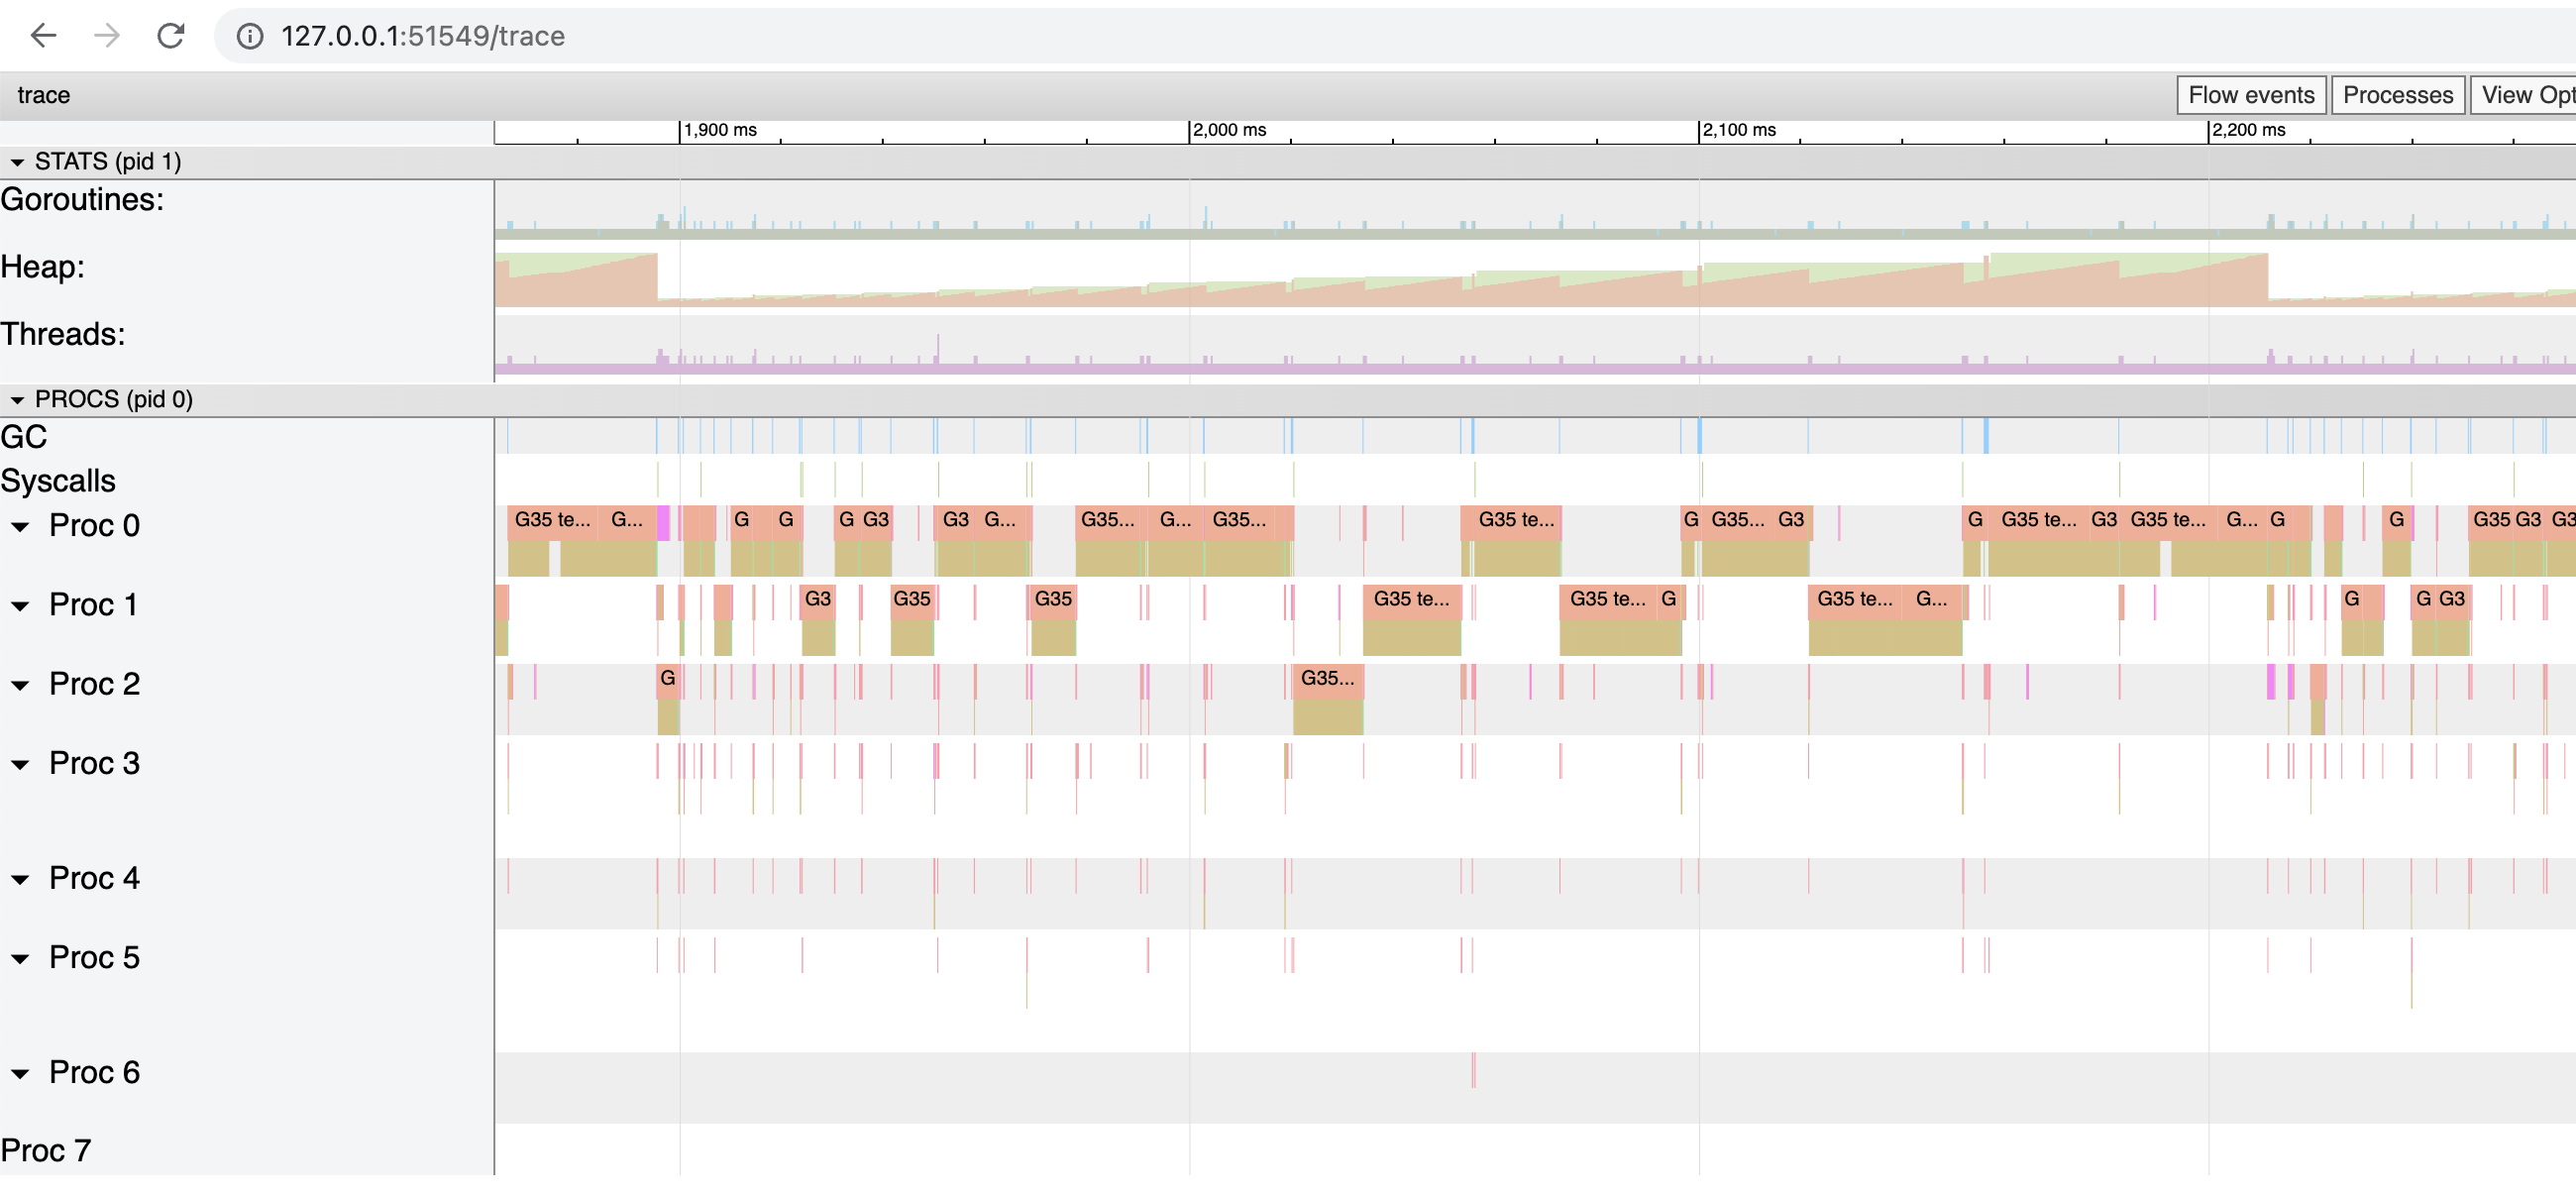
Tracing
- This is awesome! Go provides a tool for tracing where a program spends its time, which CPUs are used etc. It uses your default browser to visualise and interact with.
$ go test -bench . -benchtime=10x -run ^$ -trace trace01.out

$ go tool trace trace01.out

2022/05/03 20:35:40 Parsing trace...
2022/05/03 20:35:41 Splitting trace...
2022/05/03 20:35:41 Opening browser. Trace viewer is listening on http://127.0.0.1:51549
Miscellaneous
- See package
strconvfor function to help convert between strings and data types. E.g. strconv.ParseFloat(). -
io.Discardis anio.Writerthat can be used for when you don’t care about the write operations. For example instead of passing io.Stdout to a function you can let it discard the output while unit-testing. -
iotest.TimeoutReadercan be used to simulate a timeout error while unit-testing. - You can make a channel of empty struct to signal when an event has occurred. This avoids extra memory allocation for the channel.
isDone := make(chan struct{})

// in some go routine
close(isDone)

// listen for signal
for {
	switch {
	case <- isDone:
	// received signal
	}
}
- To get the number of CPU cores available use
runtime.NumCPU().